

Modern Alerting Systems Design for Observability Teams
Alerting is a response system, not a noise system
Alerting gets described as a monitoring feature far too often. That framing is convenient, but it hides the real problem.
Alerting is a response system, not a noise system
Alerting gets described as a monitoring feature far too often. That framing is convenient, but it hides the real problem.
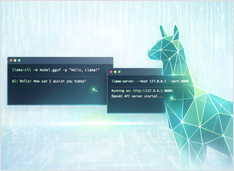
How to Install, Configure, and Use the OpenCode
I keep coming back to llama.cpp for local inference—it gives you control that Ollama and others abstract away, and it just works. Easy to run GGUF models interactively with llama-cli or expose an OpenAI-compatible HTTP API with llama-server.
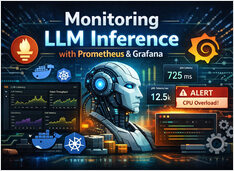
Monitor LLM with Prometheus and Grafana
LLM inference looks like “just another API” — until latency spikes, queues back up, and your GPUs sit at 95% memory with no obvious explanation.

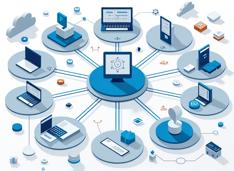
End-to-end observability strategy for LLM inference and LLM applications
LLM systems fail in ways that traditional API monitoring cannot surface — queues fill silently, GPU memory saturates long before CPU looks busy, and latency blows up at the batching layer rather than the application layer.

Metrics, dashboards, logs, and alerting for production systems — Prometheus, Grafana, Kubernetes, and AI workloads.
Observability is the foundation of reliable production systems.
Without metrics, dashboards, and alerting, Kubernetes clusters drift, AI workloads fail silently, and latency regressions go unnoticed until users complain.
Set up robust infrastructure monitoring with Prometheus
Prometheus has become the de facto standard for monitoring cloud-native applications and infrastructure, offering metrics collection, querying, and integration with visualization tools.
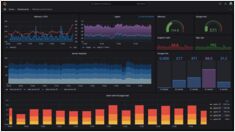
Master Grafana setup for monitoring & visualization
Grafana is the leading open-source platform for monitoring and observability, transforming metrics, logs, and traces into actionable insights through stunning visualizations.